
If you ask five reputable sources for the “top programming language,” you’ll get at least seven answers and one existential crisis. Exhibit A:
- RedMonk says JavaScript sits on the throne, based on its long-running GitHub/Stack Overflow correlation.
- IEEE Spectrum crowns Python when weighting multiple signals for what engineers actually use and hire for.
- The Stack Overflow Developer Survey shows JavaScript as the most-used language among respondents (with Python accelerating fast).
- PYPL tallies Google searches for “ tutorial” and says Python.
- GitHub Octoverse examined contribution activity across repos and announced: Python passed JavaScript.
- SlashData’s Developer Nation counts active developers by language community and typically finds JavaScript on top.
- Tiobe tracks search-engine signals and again, Python.
So are they…contradicting each other? Not really. They’re weighing different slices of reality. It’s like asking “What’s the best pizza?” and getting answers based on sales, chef votes, Instagram likes, smell radius, and number of times it shows up in late-night startup standups.

Why the rankings disagree (aka: your favorite language is both #1 and #3)
Each index bakes a different cake:
- RedMonk: Correlates GitHub activity (non-fork PRs on public repos) with Stack Overflow questions. JavaScript often wins because it’s ubiquitous in public OSS and people ask (or used to ask) about it a lot; Python rides high too. The caveat? Stack Overflow question volume has dropped in recent years as devs lean on other resources and AI assistants, which RedMonk openly discusses. Their take is fantastic for trends and “mindshare + code share” over time.
- IEEE Spectrum: Blends multiple proxies (e.g., GitHub signals, job postings, career filters) and lets you reweight for “Spectrum default” or “jobs” views. It’s great if you want a hiring/industry lens and a dial you can turn: more academic? more enterprise? Python thrives here thanks to AI/data science, education, and general-purpose versatility.
- Stack Overflow Developer Survey: Counts what respondents used in the last year. JavaScript usually tops “most used” simply because the web exists. Meanwhile, Python often tops “wanted/admired” or surges in usage growth. This is a self-reported snapshot of the ecosystem’s working hearts and minds at survey time.
- PYPL: Counts Google searches for “ tutorial”. That’s a neat proxy for learning intent. Python’s easy on-ramp, endless ML hype, and evergreen “I’m automating my life” tutorials keep it at #1 here.
- GitHub Octoverse: Rolls up contribution activity across issues, PRs, discussions, pushes, etc. In 2024, Python overtook JavaScript in overall GitHub activity. That reflects the AI/data science wave, Jupyter notebooks, and Python’s gravity in research and automation.
- SlashData / Developer Nation: Estimates active developer counts per language across the world. JavaScript typically wins by sheer “there are so many of us building web front ends and back ends” momentum. This is a people-at-scale view: “How many humans am I likely to run into using X?”
- Tiobe: Measures search-engine results and other web signals to estimate popularity. It’s historical, frequently cited, and good for trend lines — with quirks (SEO shifts can wiggle ranks).
TL;DR: One ranks by “who codes the most in public,” another by “who searches tutorials,” another by “what devs say they use,” another by “who’s hiring,” another by “how many humans use it.” Same question, different thermometers.

Methodology speed-date (no dinner, just data)
- RedMonk → GitHub PRs (public, non-fork) × Stack Overflow tag activity correlation → trend over time.
- IEEE Spectrum → Composite index across multiple proxies, tunable for industry vs. academia; strong job-market weighting.
- Stack Overflow Survey → Annual self-report of used, admired, desired; large respondent base, web-dev heavy.
- PYPL → Google “tutorial” search share → a pulse on learning/entry momentum.
- GitHub Octoverse → Broad GitHub activity (issues, PRs, pushes, comments, discussions) → real usage on repos.
- SlashData → Global survey + modeling → active developer counts per language community.
- Tiobe → Search-engine result signals + providers → visibility and mindshare footprint on the public web.
“Which index is most popular?” (the “apples vs. metric tons of apples” problem)
- Most-cited historically: Tiobe (press loves it).
- Most “what devs say they use”: Stack Overflow Survey.
- Most “what people are doing on code hosts”: GitHub Octoverse.
- Most “I need a tunable, career-focused dashboard”: IEEE Spectrum.
- Most “long-arc trend of OSS + Q&A mindshare”: RedMonk.
- Most “how many humans in each tribe”: SlashData.
Pick your poison — ideally you read at least two with different biases so their errors cancel each other out like two magnets trying to hug.

Do different communities prefer different scoreboards?
Absolutely. Web folks often nod to RedMonk and Stack Overflow (OSS + framework chatter). Data/ML researchers wave the Octoverse flag (Python all the way down, with notebooks everywhere). Enterprise hiring managers and academics reach for IEEE Spectrum. PMs who love slide decks (we see you) paste Tiobe into meetings. Analysts discussing market size cite SlashData. Beginners and educators peek at PYPL to spot on-ramp trends.
Famous art… about this?
Two fun parallels:
- Mondrian-style grids: Clean, primary-color blocks — like a heatmap of rankings with the noise turned way down.
- Minard’s Napoleon chart: Not “art” in the museum sense, but a data-viz classic — its elegance is a reminder that how you visualize data decides what truth survives the trip to your eyeballs.
Interesting tidbits to sprinkle on your dashboard donuts
- JavaScript and Python are less “rivals” and more “roommates with different chore charts.” One ships the web, the other scripts the world.
- Methodology drift matters. When a platform’s usage or search habits change (AI assistants, anyone?), indices that depend on them drift too.
- “Most used” ≠ “best paid” ≠ “fastest growing” ≠ “easiest to learn.” Hang multiple charts on the wall before you move your team to ElvishScript 2.0.

2025 winner and a wildly reasonable 2026 prediction
Counting the sources above as votes: Python leads in IEEE Spectrum, PYPL, GitHub Octoverse, and Tiobe; JavaScript leads in Stack Overflow, RedMonk, and SlashData. Edge: Python for 2025 overall.
2026 prediction: Python keeps the belt, buoyed by AI/data tooling and automation. The plot twist? TypeScript continues chewing into JavaScript’s share on large codebases, and Rust quietly collects admiration trophies like it’s building a memory-safe shrine.
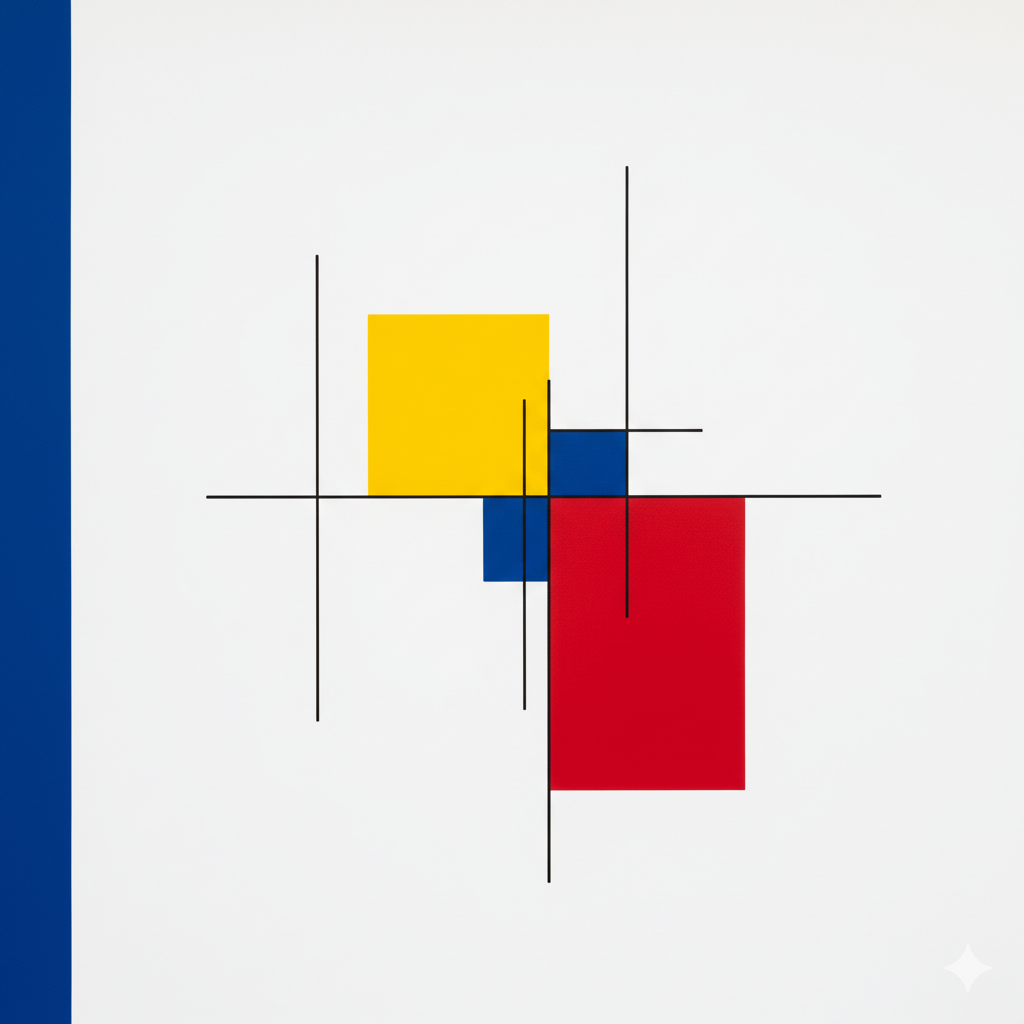
Art Prompt (Geometric): A serene composition of crisp, interlocking rectangles arranged on a pristine white field, each plane filled with saturated primary hues — crimson, ultramarine, and canary — separated by clean black lines that vary subtly in thickness. Keep the palette limited and luminous; let negative space breathe like a quiet museum gallery. Balance the canvas so that a bold red rectangle anchors the lower right while a slender blue bar stretches vertically at left, with a bright yellow square hovering above center like a small sun. Impose strict geometry and flat, untextured color fields; suggest calm, order, and inevitability. The mood is contemplative — grids whispering about harmony — while the composition invites viewers to linger on the rhythm of edges and the music of alignment.

Video Prompt: Start on a stark white background; rectangles snap into place with crisp, satisfying “clicks.” Animate black lines drawing themselves in real time, then pause to let each color field flood in like paint filling a stencil. Cut to rhythmic zooms that track along edges, pivoting at corners with 90-degree whip pans. Introduce a pulse: rectangles gently expand and contract on the beat, swapping positions in a seamless grid shuffle. Add micro-shadow parallax during moves for depth, then end with the primary forms locking into a balanced final composition as a soft vignette breathes around the frame.
Songs to pair with the video:
- Edge of the Ocean — Ivy
- Loud Pipes — Ratatat
If you made it this far, you’re my people. Smash that follow, tell me which scoreboard you trust (and why), and drop a spicy ranking hot-take in the comments. I’ll bring charts. You bring snacks.