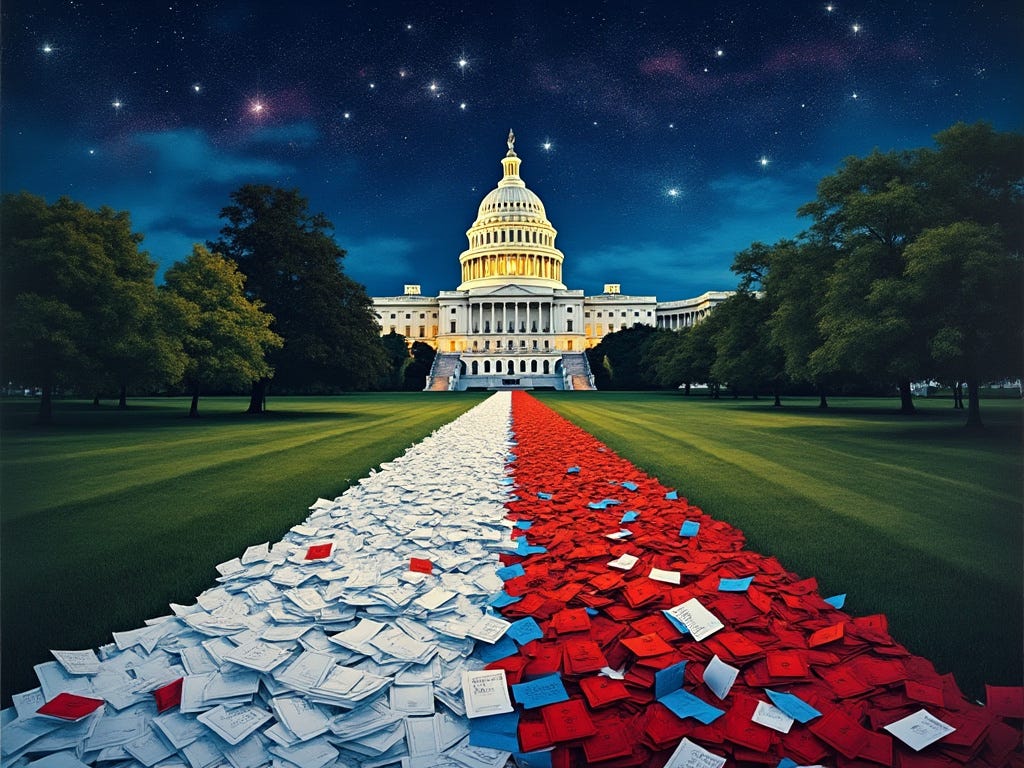
Let’s face it: every four years, we find ourselves swept up in the tidal wave of election news. And just when you think you’re out, they pull you back in! So, while I was chatting with my wife about the electoral college and the popular vote, I realized many people (including her!) don’t quite understand how these things work. Buckle up, folks, because we’re diving into this wonderfully chaotic world of voting!
What’s the Difference Anyway?
First off, let’s clarify what we mean by the popular vote and the electoral college. The popular vote is pretty straightforward: it’s the total number of votes cast by citizens in the election. You know, the one you and I cast while crossing our fingers that our candidate wins!
On the other hand, the electoral college is like that quirky uncle at family gatherings who insists on doing things his own way. The U.S. uses this system to elect its president and vice president. Instead of directly electing the president through the popular vote, we elect representatives called electors who then cast votes on our behalf. Confused? You’re not alone!
How Does the Electoral College Work?
Here’s how it goes: when you vote in an election, you’re technically voting for a slate of electors pledged to your chosen candidate. Each state has a certain number of electoral votes based on its population, and there are a total of 538 electoral votes up for grabs. To win the presidency, a candidate needs a majority — at least 270 electoral votes.
Now, you might be wondering if electors have to vote for the candidate their state chose. In most cases, yes, they are required to do so. However, a few states allow “faithless electors” to make their own choices. It’s a bit like inviting someone to your birthday party and hoping they won’t eat all the cake, only to find out they brought their own!
The Popular Vote vs. The Electoral College: A Historical Perspective
To make this even clearer, let’s take a look at the historical data. Here’s a table showcasing the popular vote versus the electoral votes since 1980 through the results as of 9:19 EST on November 6, 2024:
| Year | Candidate (Party) | Popular Vote | Electoral Votes | Opponent (Party) | Popular Vote | Electoral Votes |
|---|---|---|---|---|---|---|
| 1980 | Ronald Reagan (Republican) | 43,903,230 (50.5%) | 489 | Jimmy Carter (Democrat) | 35,480,115 (41.0%) | 49 |
| Others | 4,804,444 (5.6%) | |||||
| 1984 | Ronald Reagan (Republican) | 54,455,472 (58.8%) | 525 | Walter Mondale (Democrat) | 37,577,352 (40.6%) | 13 |
| Others | 1,288,982 (1.4%) | |||||
| 1988 | George H.W. Bush (Republican) | 48,886,097 (53.4%) | 426 | Michael Dukakis (Democrat) | 41,013,524 (45.6%) | 111 |
| Others | 1,059,295 (1.2%) | |||||
| 1992 | Bill Clinton (Democrat) | 44,909,806 (43.0%) | 370 | George H.W. Bush (Republican) | 39,104,550 (37.4%) | 168 |
| Ross Perot (Independent) | 18,915,174 (18.9%) | 0 | ||||
| 1996 | Bill Clinton (Democrat) | 47,401,185 (49.2%) | 379 | Bob Dole (Republican) | 39,198,755 (40.7%) | 159 |
| Ross Perot (Reform) | 8,085,402 (8.4%) | 0 | ||||
| 2000 | George W. Bush (Republican) | 50,456,002 (47.9%) | 271 | Al Gore (Democrat) | 51,009,797 (48.4%) | 266 |
| Ralph Nader (Green) | 2,882,955 (2.7%) | 0 | ||||
| 2004 | George W. Bush (Republican) | 62,040,610 (50.5%) | 286 | John Kerry (Democrat) | 59,028,444 (48.0%) | 251 |
| 2008 | Barack Obama (Democrat) | 69,498,516 (52.9%) | 365 | John McCain (Republican) | 59,948,323 (45.7%) | 173 |
| 2012 | Barack Obama (Democrat) | 65,915,796 (51.1%) | 332 | Mitt Romney (Republican) | 60,933,500 (47.2%) | 206 |
| 2016 | Donald Trump (Republican) | 62,984,828 (46.2%) | 304 | Hillary Clinton (Democrat) | 65,853,514 (48.2%) | 227 |
| 2020 | Joe Biden (Democrat) | 81,283,501 (51.3%) | 306 | Donald Trump (Republican) | 74,223,975 (46.8%) | 232 |
| 2024 | Donald Trump (Republican) | 72,541,108 (50.9%) | 295 | Kamala Harris (Democrat) | 67,856,529 (47.6%) | 226 |
Republic vs. Democracy: The Great Debate

Now, let’s tackle the age-old debate: what’s the difference between a republic and a democracy? Simply put, a democracy is a system where the majority rules, and every vote counts equally. A republic, on the other hand, is a system where representatives make decisions on behalf of the citizens. Think of it as a group project in school where not everyone does the same amount of work — some people just end up being more involved than others!
In our modern age, being a republic rather than a pure democracy allows for a system of checks and balances. It’s like having a safety net; it ensures that not just any wild idea can become law simply because a majority wants it.
Fun Tidbits to Wrap It Up
Before we wrap this up, here are some fun nuggets to chew on:
- The electoral college was established in 1787, and it’s been a hot topic of debate ever since. Some folks love it; others think it’s time for a makeover.
- The largest state, California, has the most electoral votes (55). No pressure, right?
- There have been five instances in U.S. history where the winner of the electoral college lost the popular vote. Talk about a plot twist!
I promise this will be my last blog entry for a while having to do with voting (unless, of course, my wife asks me more interesting questions). If you enjoyed this romp through the electoral college and popular vote, be sure to follow me for more light-hearted explorations of everyday topics!
AI Art Prompt

Generate an artistic masterpiece that symbolizes the clash between the electoral college and the popular vote: a grand, abstract representation of two paths converging, one paved with ballots and the other with electoral votes, illuminated under a starry night sky, with the U.S. Capitol in the background.
[Follow for more insights and musings on the wonderful world of voting and beyond!]